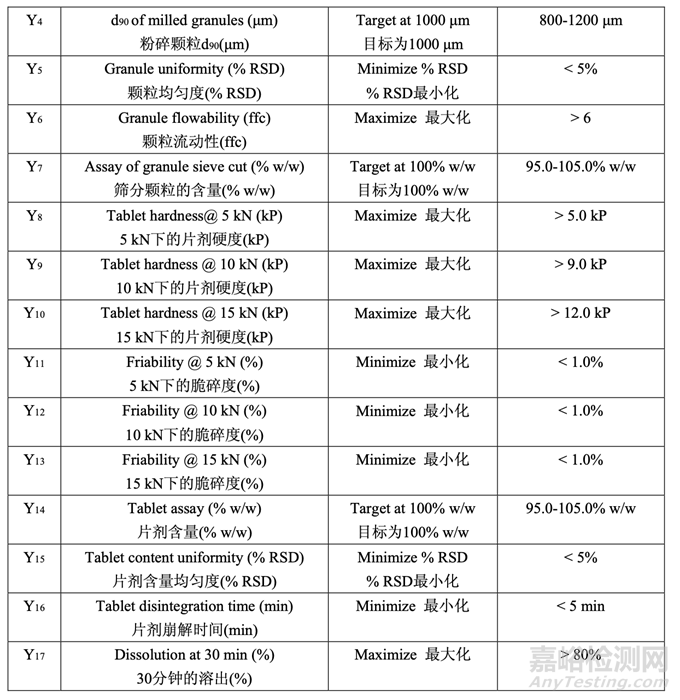
This is an example pharmaceutical development report illustrating how ANDA applicants can move toward implementation of Quality by Design (QbD). The purpose of the example is to illustrate the types of pharmaceutical development studies ANDA applicants may use as they implement QbD in their generic product development and to promote discussion on how OGD would use this information in review.
FDA官网中一个有关药物开发报告的实例,用以说明申请人如何实施质量源于设计(QbD)。 该实例的目的是说明ANDA申请人在其仿制药开发过程中实施QbD时,可使用的药物开发研究的类型,同时促进探讨OGD在审评中如何使用该信息。
本文主要概述了制剂生产工艺开发的风险评估要点,以及预碾压混合、润滑、碾压和粉碎。
2.3 Manufacturing Process Development 生产工艺的开发
Note to Reader: There are various approaches to process development used in the generic pharmaceutical industry. This is one of many possible examples. All QbD approaches to process development should identify the critical material attributes (CMAs) and critical process parameters (CPPs) for each process step. A firm may choose to do this through reference to documented prior knowledge or through empirical experiments on a range of process scales building toward the exhibit scale and proposed commercial scale. The process development of pre-roller compaction blending and lubrication is an example of experimentally determining CPPs when there is variation in an input material attribute. QbD emphasizes building understanding to avert failures during scale-up. The multivariate experiments described here are a step toward defining acceptable ranges for CPPs and CMAs.
仿制药行业中使用的工艺开发有多种方法。这是多种可能实例中的一种。工艺开发 的所有QbD方法应确定每个工艺步骤的关键物料属性(CMAs)和关键工艺参数(CPPs)。公司 可选择通过参考记录的先前知识或通过工艺规模范围内建立申报规模和拟定工业规模的实 证实验来进行。预碾压混合和润滑工艺的开发是当输入物料属性发生变化时,通过实验确定 CPPs的例子。QbD强调放大期间应建立理解以避免失败。此处描述的多元实验是迈向定义CPPs和CMAs可接受范围的一步。
Steps to establish process understanding are as follows:
建立工艺理解的步骤如下:
Identify all possible known material attributes and process parameters that could impact the performance of the process.
确定所有可能可影响工艺性能的已知物质属性和工艺参数。
Use risk assessment and scientific knowledge to identify potentially high risk attributes and/or parameters.
使用风险评估和科学知识以确定潜在的高风险属性和/或参数。
Identify levels or ranges of these potentially high risk attributes and/or parameters. 确定这些潜在的高风险属性和/或参数的水平或范围。
Design and conduct experiments, using DOE when appropriate. 如适用,使用DOE进行设计并进行实验。
Analyze the experimental data to determine if a material attribute or process parameter is critical.
分析实验数据以确定物质属性或工艺参数是否关键。
- A material attribute or process parameter is critical when a realistic change in that attribute or parameter can significantly impact the quality of the output material.
关键的物质属性或工艺参数是当属性或参数实际变化时,可显著影响输出物料质量。 Develop a control strategy. 开发控制策略
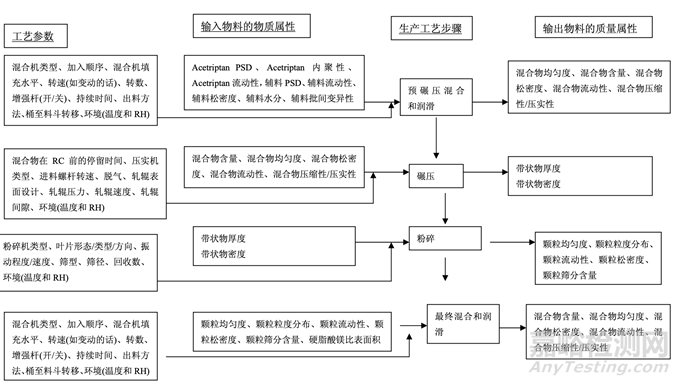
As discussed in Section 2.2.1.3 Process Selection, roller compaction was chosen as an appropriate granulation method to avoid drug product degradation and the equipment train was selected. Figure 21 presents the process map for the finalized formulation of Generic Acetriptan Tablets, 20 mg. Each process step in the manufacturing process is listed in the sequence of occurrence. It also presents the material attributes and process parameters that can potentially impact intermediate and finished product quality attributes. The material attributes of the input materials and the process parameters used at the very first process step determine the quality attributes of the output material (intermediate) produced at this step. Material attributes of the intermediate from this step and process parameters of the subsequent process step in the manufacturing process will determine quality attributes of the next intermediate and, eventually, those of the finished drug product. This cycle repeats until the final process step where finished drug product is manufactured and the product quality attributes are evaluated. This map was used to guide the risk assessments performed during process development.
如2.2.1.3节工艺选择所述,选择碾压作为一种适宜制粒方法以避免制剂降解并选择了设备培 训。图21为仿制药20 mg Acetriptan片最终确定的处方的工艺图。生产工艺中的每个工艺步骤 按发生顺序列出。也显示了可潜在影响中间体和成品质量属性的物料属性和工艺参数。第一 道工艺步骤使用的输入物料的物质属性和工艺参数决定了该步骤生产的输出物料(中间体) 的质量属性。该步骤中间体的物质属性和生产工艺中随后工艺步骤的工艺参数将决定下一个 中间体的质量属性并最终决定成品制剂的质量属性。该循环重复直至生产成品制剂和评估产 品质量属性的最后的工艺步骤。该工艺图用于指导工艺开发中进行的风险评估。 Manufacturing process development studies were conducted at the 5.0 kg lab scale, corresponding to 25,000 units.
在 5.0 kg 实验室规模,相当于 25,000 单位下进行生产工艺开发研究。
Figure 21. Process map for Generic Acetriptan Tablets, 20 mg
图 21 仿制药 20 mg Acetriptan 片的工艺图
2.3.1 Initial Risk Assessment of the Drug Product Manufacturing Process
药品生产工艺的初始风险评估
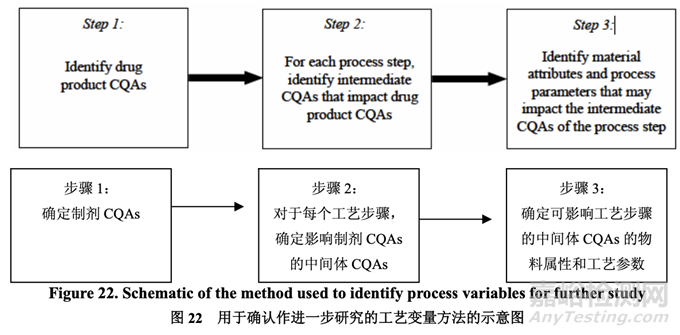
A risk assessment of the overall drug product manufacturing process was performed to identify the high risk steps that may affect the CQAs of the final drug product. Subsequently, the intermediate CQAs of the output material from each process step that impact the final drug product CQAs were identified. For each process step, a risk assessment was conducted to identify potentially high risk process variables which could impact the identified intermediate CQAs and, ultimately, the drug product CQAs. These variables were then investigated in order to better understand the manufacturing process and to develop a control strategy to reduce the risk of a failed batch. This method of identifying process variables for further study is illustrated in Figure 22 and is applied in each process step risk assessment.
进行整体药品生产工艺的风险评估以确定可能影响最终药品 CQAs 的高风险步骤。随后,确 定影响最终药品 CQAs 的各个工艺步骤输出物料的中间体 CQAs。对于各个工艺步骤,进行 风险评估以确定可能影响已确定的中间体 CQAs 并最终影响药品 CQAs 的潜在高风险工艺变 量。然后研究这些变量以便更好的理解生产工艺并开发一种控制策略以降低失败批的风险。 这种用于进一步研究以确定工艺变量方法的说明见图 22 并用于各个工艺步骤风险评估。
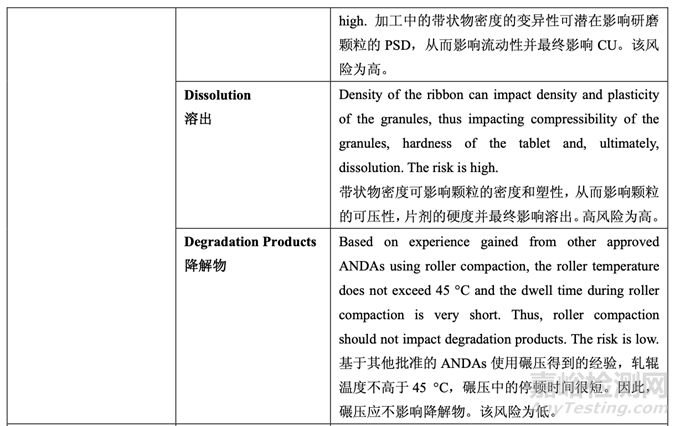
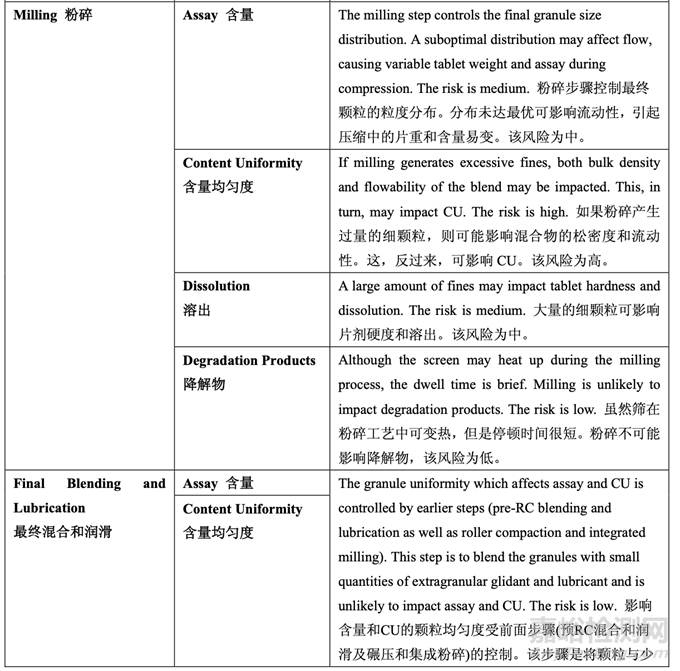
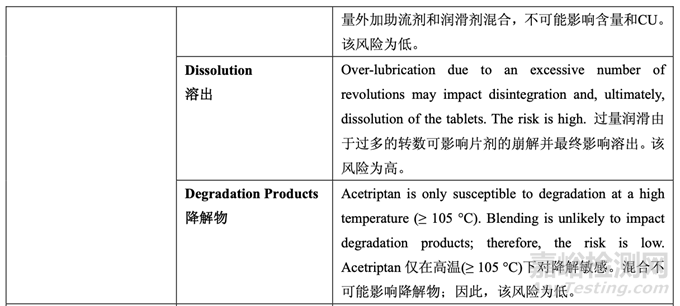
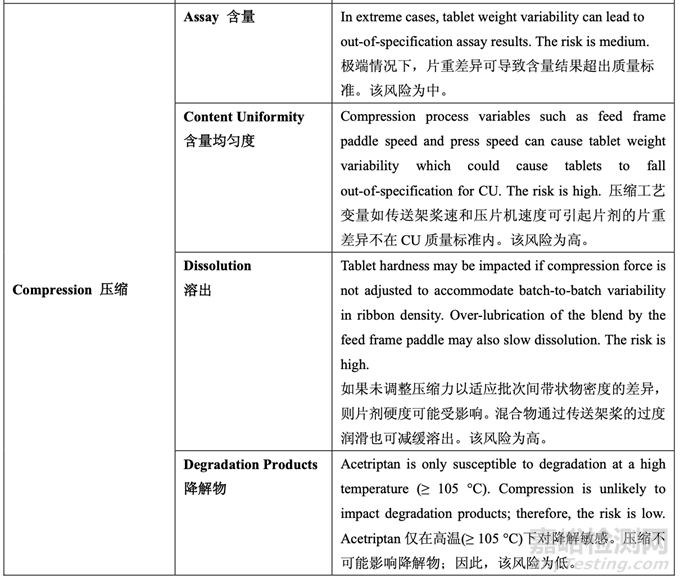
The initial risk assessment of the overall manufacturing process is shown in Table 32 and justifications are provided in Table 33. Previous experience with these process steps was used to determine the degree of risk associated with each process step and its potential to impact the CQAs of the finished drug product.
整体生产工艺的初始风险评估见表 32,依据见表 33。使用这些工艺步骤的先前经验用于决 定与各个工艺步骤相关的风险程度和其影响成品制剂 CQAs 的潜在性。
Further risk assessment was performed subsequently on each high risk process step to identify which process variables may potentially impact the intermediate CQAs. Evaluation of all possible process variables that could potentially impact the quality attributes of the output material of any given process step is not feasible; therefore, some of the variables were set constant based on current understanding.
随后对各个高风险工艺进行进一步的风险评估以确定哪些工艺变量可潜在影响中间体 CQAs。评估所有可能的工艺变量,可潜在影响任何给定工艺步骤输出物料的质量属性,是 不可行的;因此,基于现行的理解,设置某些变量为常数。
2.3.2 Pre-Roller Compaction Blending and Lubrication Process Development
预碾压混合和润滑工艺开发
Initial Risk Assessment of the Pre-Roller Compaction Blending and Lubrication Process Variables
预碾压混合和润滑工艺变量的初始风险评估
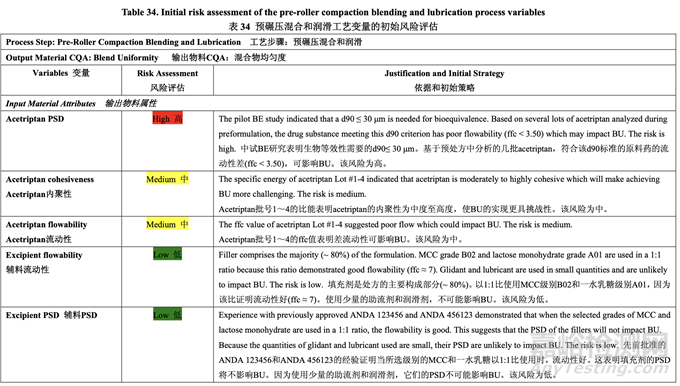
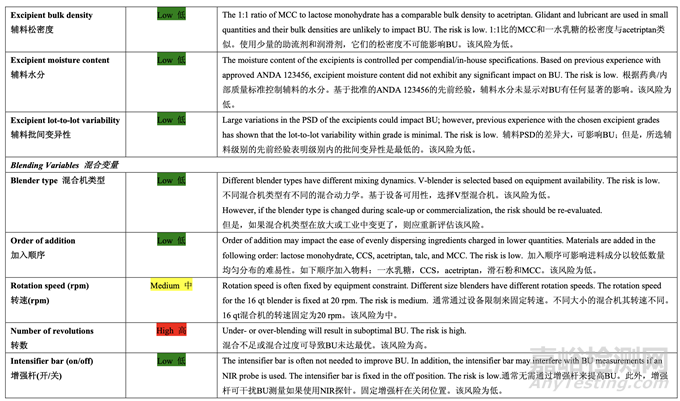
The initial risk assessment of the overall manufacturing process presented in Table 32 identified the risk of the pre-roller compaction blending and lubrication step to impact tablet content uniformity as high. Subsequently, blend uniformity was identified as an intermediate CQA of the powder blend from the pre-roller compaction blending and lubrication step. Process variables that could potentially impact blend uniformity were identified and their associated risk was evaluated. Table 34 presents the initial risk assessment for the pre-roller compaction blending and lubrication step.
表 32 所示的整体生产工艺的初始风险评估中,确定预碾压混合和润滑为可影响片剂含量均 匀度的高风险步骤。随后,混合物均匀度确定为预碾压混合和润滑步骤的粉末混合物中间体 CQA。确定了可潜在影响混合物均匀度的工艺变量并评估了它们相关的风险。表 34 呈现了 预碾压混合和润滑步骤的初始风险评估。
Effect of Acetriptan PSD and Number of Revolutions on Blend Uniformity
Acetriptan PSD
和转数对混合物均匀度的影响
Due to its low solubility, acetriptan is milled to improve its bioavailability. The milled drug substance has poor flow characteristics and is cohesive. Thus, roller compaction is performed prior to compression to achieve tablet content uniformity. The success of roller compaction to produce uniform granules is largely contingent on the uniformity of the blend achieved during the preceding blending and lubrication step.
由于其溶解度低,粉碎acetriptan以提高其生物利用度。粉碎的原料药的特点是流动性差和具 有内聚性。因此,在压缩前进行碾压以达到片剂含量均匀度。成功碾压生产均匀的颗粒主要 视之前混合和润滑步骤中达到的混合物的均匀度而定。
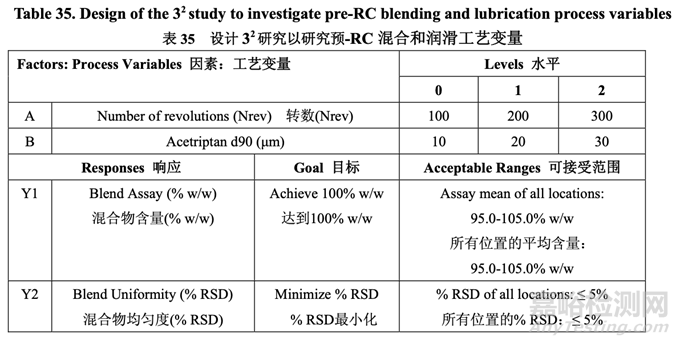
The pilot PK study suggested that Generic Acetriptan Tablets, 20 mg, with a drug substance d90 of 30 μm (d50 of 24 μm) or less would be bioequivalent to the RLD. During formulation development, a PSD with a d90 less than 14 μm led to flow and content uniformity issues. However, the blending process was fixed at that stage of development. Thus, it was important to determine if an optimized blending process could accommodate different acetriptan PSD without adversely impacting blend uniformity. A two-factor, three-level full factorial DOE, as shown in Table 35, was used to investigate the impact of acetriptan PSD (d90) and number of revolutions (Nrev) on blend uniformity. Blender fill level is also likely to impact blend uniformity based on the initial risk assessment, but this process parameter was evaluated subsequent to the DOE. The optimized formulation shown in Section 2.2.1.6 Table 29 was used for this study.
中试 PK 研究表明仿制药 20 mg Acetriptan 片,其原料药 d90 为 30 μm (d50 为 24 μm)或以下, 将生物等效于 RLD。在处方开发中,d90 低于 14 μm 的 PSD 导致流动性和含量均匀度问题。 但是,在开发的阶段固定了混合工艺。因此,重要的是确定优化的混合工艺是否能适应不同 的 acetriptan PSD 而对混合物均匀度无不良影响。2 因素,3 水平全因子 DOE,如表 35 所示, 用于研究 acetriptan PSD (d90)和转数(Nrev)对混合物均匀度的影响。混合机填料水平也可能 影响混合物均匀度基于初始风险评估,但是该工艺参数在 DOE 之后进行了评估。2.2.1.6 节 表 29 所示的优化处方用于该研究。
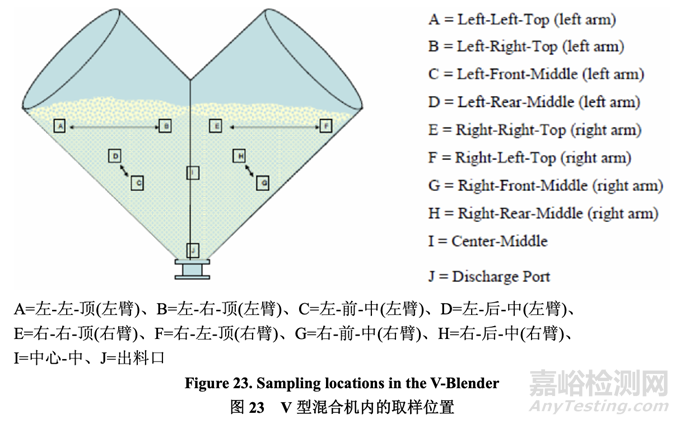
Each 5.0 kg batch was blended in a 16 qt blender operated at 20 rpm. To measure blend uniformity, sampling was performed at the 10 blender locations designated in Figure 23 at the end of the specified number of revolutions. The sample thief was calibrated such that the collected sample volume represented one to three unit doses of blend (200.0-600.0 mg).
20 rpm 下运行的 16 qt 混合机内混合各个 5.0 kg 批次。为测量混合物均匀度,在规定转数的 末端,在图 23 标明的混合机 10 个位置进行取样。校正取样器以便采集的样本量代表混合物 的 1~3 个单位剂量(200.0~600.0 mg)。
The blend uniformity results are presented in Table 36.
混合物均匀度结果见表 36。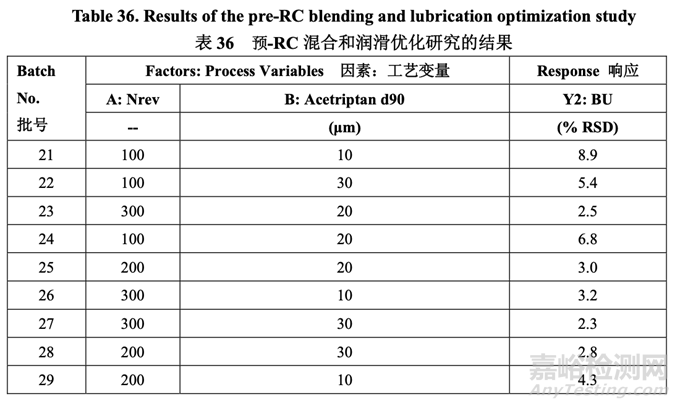
Based on the sum of squares of sequential models (i.e., linear, two factor interaction, quadratic and cubic), the highest order polynomial model was selected where the additional terms were significant and the model was not aliased. The model terms were further reduced based on the significance level (α = 0.05) using the backward model selection method.
基于顺序模型(即线性,两因素交互作用,二次和三次)的平方和,选择最高阶多项式模型,因为该模型中附加项显著且模型不重叠。基于使用后向模型选择法的显著水平(α = 0.05),可 进一步减少模型项。
Significant factors for blend uniformity 混合物均匀度的显著因素
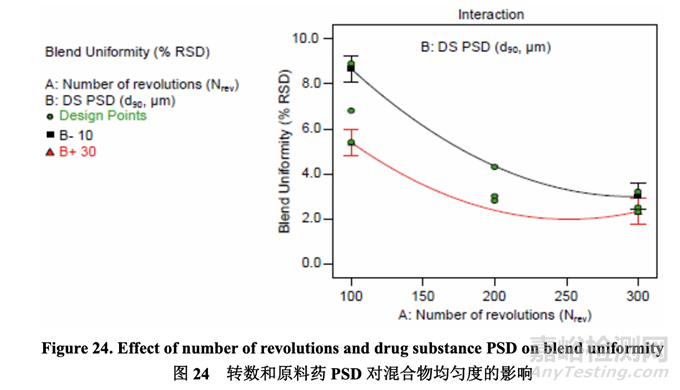
The effect of A (Nrev) and B (drug substance PSD) on blend uniformity was best described by a quadratic model where the significant factors were A, B, AB interaction and A2. The interaction plot below (Figure 24) shows that the blend uniformity response depended on the settings of the two factors. At a lower number of revolutions, the acetriptan PSD had a greater impact on blend uniformity than at a higher number of revolutions. At 100 revolutions, each of the three acetriptan PSD investigated failed to meet the predefined criterion of less than 5% RSD. 通过二次模型最好的描述了 A (Nrev)和 B (原料药 PSD)对混合物均匀度的影响,其中显著因 素为 A, B, AB 交互作用和 A2。交互作用图以下(图 24)显示出混合物均匀度响应依赖于两个 因素的设置。更低转数下的acetriptan PSD对混合物均匀度的影响较更高转数大。100转数 下,研究的 3 个 acetriptan PSD 中的每一个都不符合预定义标准:低于 5% RSD。
Significant factors for blend assay 混合物含量的显著因素
Neither the number of revolutions nor the drug substance PSD had a significant impact on mean blend assay. Results were close to the target for each run and ranged from 98.7%-101.2% overall. 转数和原料药PSD都不显著影响混合物平均含量。结果接近于每个批的目标,总体范围为 98.7%~101.2%。
Development of In-line NIR for Blending Endpoint Determination
开发在线NIR用于混合终点判断
Note to Reader: NIR method development and validation is beyond the scope of the pharmaceutical development report and the details are not discussed in this example. The validation report should be included in Section 3.2.P.5.3 Validation of Analytical Procedures. 致读者:NIR方法的开发和验证超出了药物开发报告的范围,该实例中将不详细讨论。验证 报告应包括在3.2.P .5.3节分析方法验证中。
In order to ensure a homogeneous blend for any input acetriptan drug substance d90 within the range of 10-30 μm, an in-line NIR spectrophotometric method was developed and validated. This technology allows a real-time response and can be used at the laboratory, pilot and commercial scale. During validation, blend uniformity data collected at various time points by the NIR method was compared to that obtained by traditional thief sampling followed by offline HPLC analysis and was found to be comparable.
为保证任何输入的d90在10~30 μm范围内的acetriptan原料药混合均匀,开发并验证了一种在 线NIR分光光度法。该技术提供了实时响应,可用于实验室,中试和工业规模。在验证中, 通过NIR法在各个时间点采集的混合物均匀度数据与通过传统容器内指定部位取样再用离 线HPLC分析获得的数据比较,发现两者具有可比性。
Additionally, validation showed that blends deemed homogeneous by the NIR method ultimately produced tablets with acceptable content uniformity (% RSD < 5%). Based on these findings, the NIR method is capable of accurately assessing the real-time homogeneity of the blend and can be used to control the endpoint of the blending process. Further information regarding the NIR method development and validation can be found in Section 3.2.P.5.3 Validation of Analytical Procedures.
此外,验证表明通过 NIR 法认为均匀的混合物最终生产的片剂其含量均匀度合格(% RSD < 5%)。基于这些研究结果,NIR 法能准确评估混合物的实时均匀性并可用于控制混合工艺的 终点。关于 NIR 法开发和验证的另外信息见 3.2.P.5.3 节分析方法验证。
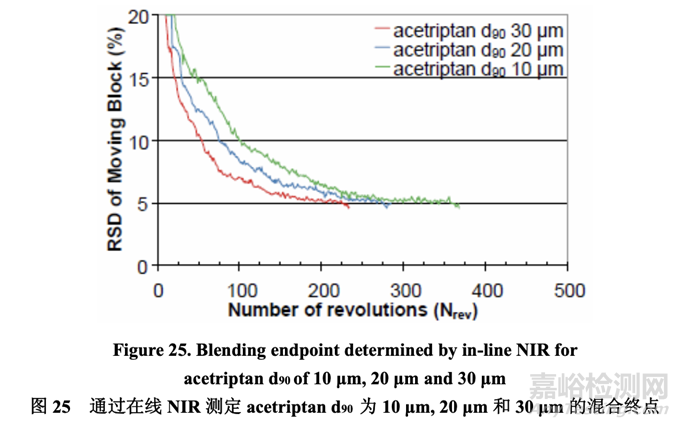
Three 5.0 kg batches (Batch Nos. 30-32) were manufactured using acetriptan with a d90 of 10 μm, 20 μm, and 30 μm, respectively. During blending, one spectrum was acquired non-invasively through the sight glass of the V-blender for each revolution as the V-blender was in the inverted position. The NIR spectra were preprocessed to minimize the effects of particle size and path length and to resolve the acetriptan peak. To assess the homogeneity of the blend, % RSD was calculated for each moving block of ten consecutive spectra and plotted as a function of number of revolutions. The blend was considered homogeneous once the % RSD was below 5% for ten consecutive measurements. This criterion ensured that brief excursions below the 5% threshold did not result in blending termination.
分别使用d90为10 μm, 20 μm和30 μm的acetriptan生产了各5.0 kg的3个批次(批号30~32)。在 混合中,通过V型混合机的观察孔得到了每个转速的无损光谱,当V型混合机处于倒转层位 时。预处理NIR光谱以使粒径和光程长度的影响最小化并分离acetriptan峰。为评估混合物的 均匀性,计算10个连续光谱中的每个移动区的% RSD并根据转数绘图。一旦10个连续测量值 的% RSD低于5%,可认为混合均匀。该标准保证了低于5%阈值的短漂移不发生混合终点。
For an acetriptan d90 of 10 μm, 20 μm and 30 μm, the blending endpoint determined by NIR as shown in Figure 25 was 368 revolutions, 285 revolutions and 234 revolutions, respectively. The blending uniformity showed rapid initial change through macro (convection) mixing followed by slower micro (diffusion) mixing.
对于 d90 为 10 μm, 20 μm 和 30 μm 的 acetriptan,通过 NIR 判断的混合终点分别为 368 转数, 285 转数和 234 转数,如图 25 所示。混合均匀度显示先通过宏观(对流)混合然后通过较慢的 微观(扩散)混合进行快速初始变化。
A fourth 5.0 kg batch (Batch No. 33) was manufactured using acetriptan with a d90 of 20 μm. The validated NIR method was used to determine the blending endpoint, but feedback control was not used to terminate the process. Blending was continued for a total of 500 revolutions to look for evidence of demixing. Figure 26 indicates that demixing did not occur as the % RSD did not increase when the batch was blended beyond the NIR-determined endpoint for a total of 500 revolutions.
使用d90为20μm的acetriptan生产了第4个5.0 kg的批次(批号33)。经验证的NIR法用于 判断混合终点,但是不使用反馈控制来终止过程。继续混合至共 500 转数以寻找混合物分离 的证据。图26表明未发生混合物分离由于% RSD未增加,当该批在NIR-判断的终点范围 外进行混合至共 500 转数时。
Effect of Blender Fill Level on Blend Uniformity
混合机填充水平对混合物均匀度的影响
Another study was performed to evaluate the impact of blender fill level on blend uniformity using acetriptan Lot #2 with a d90 of 20 μm. Each blend (Batch Nos. 34-36) was mixed in a 16 qt V-blender at 20 rpm and monitored using an NIR probe. Blend uniformity was achieved at approximately 280-290 revolutions for all three fill levels, 35%, 55% and 75%, indicating that blender fill level does not have a significant impact on the blending endpoint within the range of fill levels studied
使用d90为20μm的acetriptan批号2进行了另一个研究以评估混合机填充水平对混合物均匀度 的影响。在16 qt V型混合机内,以20 rpm混合每个混合物(批号34~36)并用NIR探针监测。 所有3个填充水平,35%, 55%和75%,在约280~290转数时达到了混合均匀,表明混合机填 充水平在研究的填充水平范围内对混合终点无显著影响。
Summary of Pre-Roller Compaction Blending and Lubrication Process Development
预碾压混合和润滑工艺开发的总结
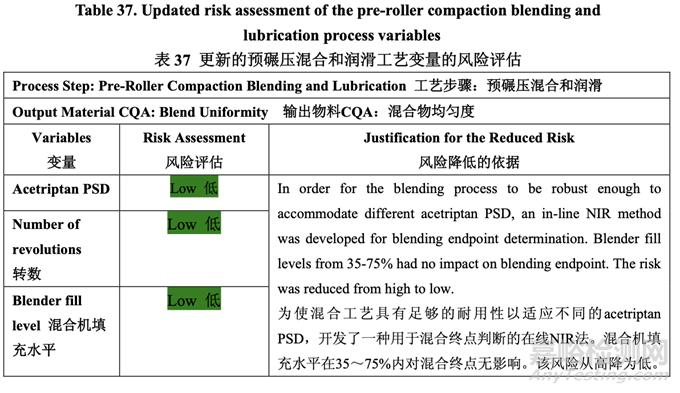
Based on the results of the pre-roller compaction blending and lubrication studies, an in-line NIR method will be used to determine the blending endpoint. The number of revolutions needed to achieve blend uniformity differed depending on the acetriptan d90 in the range of 10-30 μm. Within the range of 35-75%, the blender fill level did not adversely impact blend uniformity. 基于预碾压混合和润滑研究的结果,在线NIR法将用于判断混合终点。需要达到混合均匀的 转数是不同的,取决于d90在10~30 μm范围内的acetriptan。在35~75%范围内,混合机填充 水平对混合物均匀度无不良影响。
Updated Risk Assessment of the Pre-Roller Compaction Blending and Lubrication Process Variables
更新的预碾压混合和润滑工艺变量的风险评估
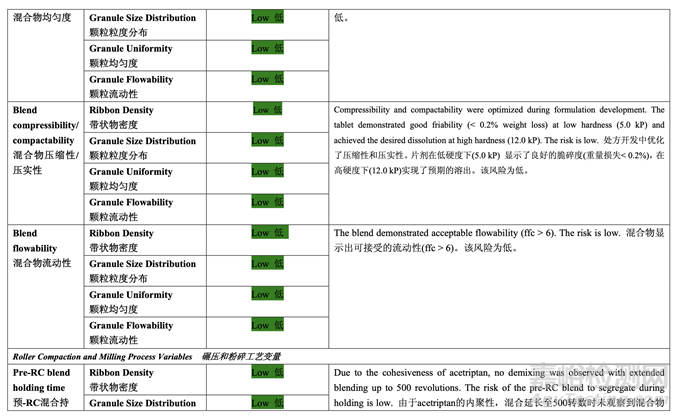
Table 37 presents the risk reduction for the pre-roller compaction blending and lubrication process as a result of the development studies. Only the process variables that were initially identified as high risk to the blend uniformity are shown.
表 37 呈现了由于开发研究而降低了预碾压混合和润滑工艺的风险。仅显示了初始确定为混 合物均匀度高风险的工艺变量。
2.3.3 Roller Compaction and Integrated Milling Process Development
碾压和集成粉碎工艺开发
Initial Risk Assessment of the Roller Compaction and Integrated Milling Process Variables
碾压和集成粉碎工艺变量的初始风险评估
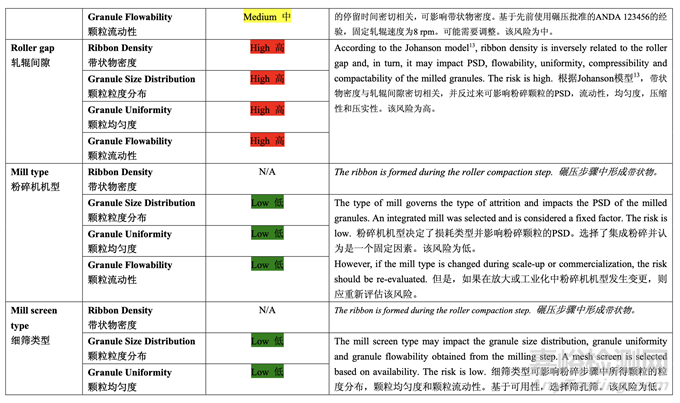
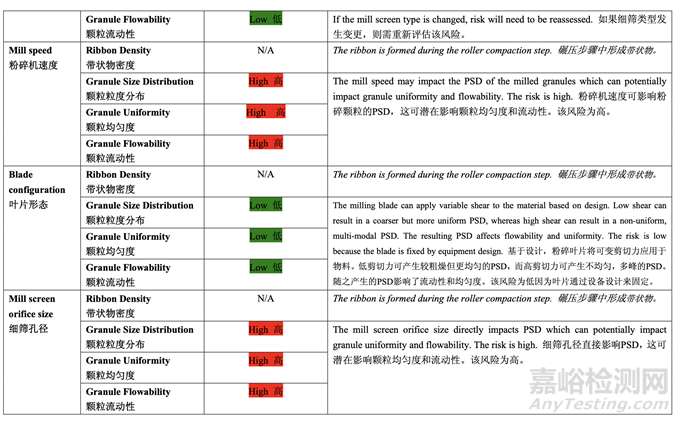
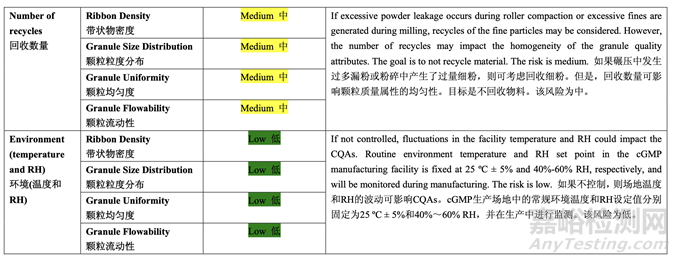
Based on the initial risk assessment of the overall manufacturing process shown in Table 32, the risk of the roller compaction step to impact tablet content uniformity and dissolution was identified as high and the risk of the milling step to impact tablet content uniformity was identified as high. Due to equipment availability, an Alexanderwerk10 WP120 roller compactor with integrated milling was used for this study. Therefore, these two steps were studied together. Subsequently, ribbon density, granule size distribution, granule uniformity and granule flowability were identified as the intermediate CQAs of the output material from the roller compaction and integrated milling step. Ribbon density is an intermediate CQA because it has a direct impact on granule particle size distribution, granule bulk and tapped density, granule flowability, and, ultimately, tablet hardness and dissolution. Granule size distribution, granule uniformity and granule flowability are intermediate CQAs because they are intimately related to tablet weight variability and content uniformity. The input material attributes and process parameters for this step that could potentially impact the four intermediate CQAs of the output material were identified and their associated risk was evaluated. The result of the initial risk assessment is summarized in Table 38.
基于整体生产工艺的初始风险评估,如表 32 所示,确定碾压步骤是影响片剂含量均匀度和 溶出的高风险,粉碎步骤是影响片剂含量均匀度的高风险。由于设备的可用性,该研究使用 带集成粉碎的Alexanderwerk10 WP120压实机。因此,这两个步骤一起进行了研究。随后, 确定了带状物密度,颗粒粒度分布,颗粒均匀度和颗粒流动性为碾压和集成粉碎步骤的输出 物料的中间体 CQAs。带状物密度为中间体 CQA,因为它直接影响颗粒粒度分布,颗粒松 密度和振实密度,颗粒流动性并最终影响片剂硬度和溶出。颗粒粒度分布,颗粒均匀度和颗 粒流动性为中间体 CQAs,因为它们与片重差异和含量均匀度密切相关。确定了该步骤可潜 在影响输出物料的 4 个中间体 CQAs 的输入物料属性和工艺参数并评估了它们相关的风险。 表 38 总结了初始风险评估的结果。
Effect of Roller Pressure, Roller Gap, Milling Speed and Mill Screen Orifice Size
轧辊压力,轧辊间隙,粉碎速度和细筛孔径的影响
The main objective of the study was to evaluate the effect of the roller compaction and integrated milling process parameters on the quality attributes of the ribbon, milled granules and finished drug product using DOE. The process parameters investigated were roller pressure, roller gap, milling speed and mill screen orifice size.
本研究的主要目的是使用DOE来评估碾压和集成粉碎工艺参数对带状物,粉碎颗粒和成品制 剂质量属性的影响。研究的工艺参数是轧辊压力,轧辊间隙,粉碎速度和细筛孔径。
A preliminary feasibility experiment was conducted to study the effect of roller pressure on the quantity of by-pass material (un-compacted material). The study showed that within the roller pressure range of 20-80 bar, the quantity of by-pass material was less than 5% and the potency matched that of the blend fed into the roller compactor. Therefore, the roller pressure range of 20-80 bar was suitable for further studies. During the feasibility study, product temperature was monitored by a non-invasive measuring device. No significant increase (> 5°C) was observed. The ranges for roller gap, mill speed and mill screen orifice size were selected based on previous experience with approved ANDA 123456 and ANDA 456123.
进行了一个初步可行性实验来研究轧辊压力对旁通物料(未压缩物料)数量的影响。研究表明 轧辊压力在 20~80 bar 范围内,旁通物料数量低于 5%,效价与加料进入压实机的混合物匹 配。因此,20~80 bar 范围内的轧辊压力适用于进一步研究。在可行性研究中,产品温度通 过无损测量设备监测。观察到无显著性增加(> 5°C)。基于之前批准的 ANDA 123456 和 ANDA 456123 的经验,选择了轧辊间隙,粉碎机速度和细筛孔径的范围。
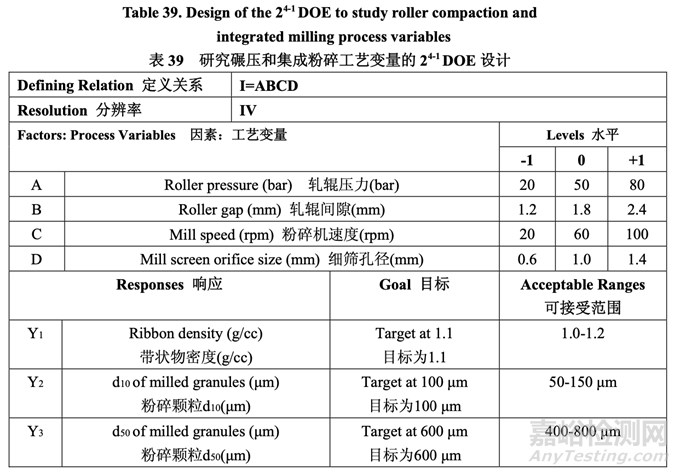
For this study, a 24-1 fractional factorial DOE was used and three center points were included to evaluate if any curvature effects exist. Table 39 presents the study design.
对于该研究,使用 24-1 部分析因 DOE 并包括了 3 个中心点以评估是否存在任何的曲率效应。 研究设计见表 39。
Approximately 50.0 kg of the intragranular excipients and drug substance (Lot #2) were blended in a 150 L diffusive V-blender operated at 12 rpm. The blender was equipped with an NIR probe to monitor the blending endpoint (RSD < 5%, target revolutions ~234). The powder mixture was subdivided into 11 batches, each ~4.5 kg in size. The remaining 0.5 kg of powder was used as a control and was not roller compacted.
以12 rpm运行的150 L扩散型V型混合机内,将约50.0 kg内加辅料和原料药(批号2)进行混合。 混合机装备有NIR探针以监测混合终点(RSD < 5%, 目标转数~234)。粉末混合物细分为11个 批次,每批数量各~4.5 kg。剩余0.5 kg粉末作为对照使用,不进行碾压。
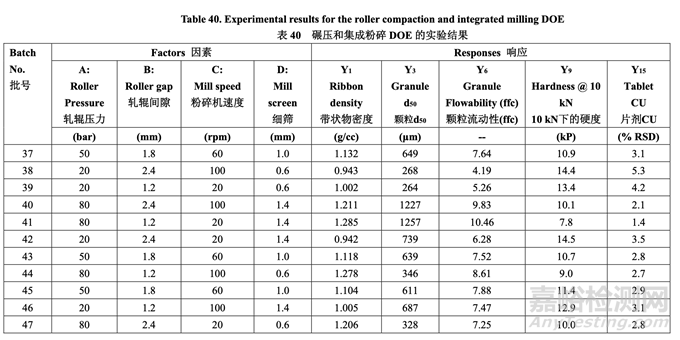
Each batch of blended powder was roller compacted using an Alexanderwerk WP120 (roller diameter 120 mm and roller width 25 mm) using the parameters defined in Table 40. The integrated milling unit on the Alexanderwerk WP120 is equipped with a ribbon crusher and a two-step milling apparatus. The ribbon is crushed into small flakes. The crushed flakes will first go through a coarse screen milling (sizing) step in which the rotor operates at 80% of the milling speed used for the second step. The second step is designed for final milling. In this study, the coarse screen size was fixed at 2.0 mm. The milling speed and milling screen orifice size of thesecond step are shown in Table 40.
每批混合的粉末使用Alexanderwerk WP120(轧辊直径120 mm和轧辊宽度25 mm)并使用表40 定义的参数进行碾压。在Alexanderwerk WP120上的集成粉碎装置装备有带条轧碎机和两步 粉碎设备。将带状物粉碎为小片。粉碎的小片首先通过粗筛粉碎(分级)步骤,叶轮以第二步 骤使用的80%粉碎速度运行。设计第二步骤用于最终粉碎。该研究中,粗筛径固定在2.0 mm。 第二步骤的粉碎速度和粉碎筛孔径见表40
The milled granules were blended with talc for 100 revolutions in a 16 qt V-blender operated at 20 rpm. Magnesium stearate was then added and blended for an additional 80 revolutions. Each batch was compressed into tablets with a target weight of 200.0 mg. The tablet hardness and friability were studied as a function of main compression force. Three compression forces, 5 kN, 10 kN and 15 kN, were used. To study tablet assay, content uniformity (% RSD), disintegration and dissolution, the main compression force was adjusted to achieve a target hardness of 9.0 kP (8.0-10.0 kP was allowed).
以 20 rpm 运行的 16 qt V 型混合机内,将粉碎颗粒与滑石粉混合 100 转数。然后加入硬脂酸 镁并混合另外 80 转数.每批压制为目标重量为 200.0 mg 的片剂。研究了片剂硬度和脆碎度与 主压缩力的关系。使用了 3 种压缩力,5 kN, 10 kN 和 15 kN。为研究片剂含量,含量均匀 度(% RSD),崩解和溶出,调整主压缩力以达到目标硬度 9.0 kP(允许的范围为 8.0~10.0 kP)。
Table 40 presents the experimental results for ribbon density, mean granule size (d50), granule flowability (ffc), tablet hardness observed at 10 kN force and tablet content uniformity (% RSD) (other responses not shown). 表40呈现了带状物密度,颗粒平均粒径(d50),颗粒流动性(ffc),片剂在10 kN压缩力下观 察到的硬度和片剂含量均匀度(% RSD)的实验结果(其他响应未显示)。
Significant factors for ribbon density 带状物密度的显著因素
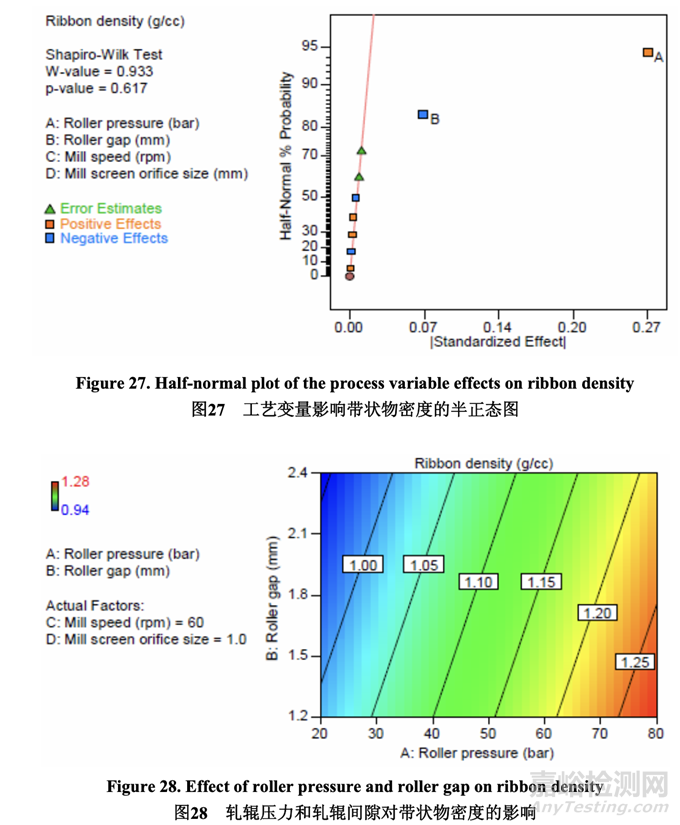
As shown in the half-normal plot (Figure 27), the significant factors affecting ribbon density were A (roller pressure) and B (roller gap). The effect of roller pressure and roller gap on ribbon density is presented in Figure 28. Ribbon density increased with increasing roller pressure (positive effect) and decreasing roller gap (negative effect).
如半正态图(图 27)所示,影响带状物密度的显著因素为 A (轧辊压力)和 B (轧辊间隙)。轧辊压力和轧辊间隙对带状物密度的影响见图 28。带状物密度随 轧辊压力(正作用)增加而增加,随轧辊间隙(负作用)减少而增加。
Significant factors for mean granule size (d50) 颗粒平均粒径(d50)的显著因素
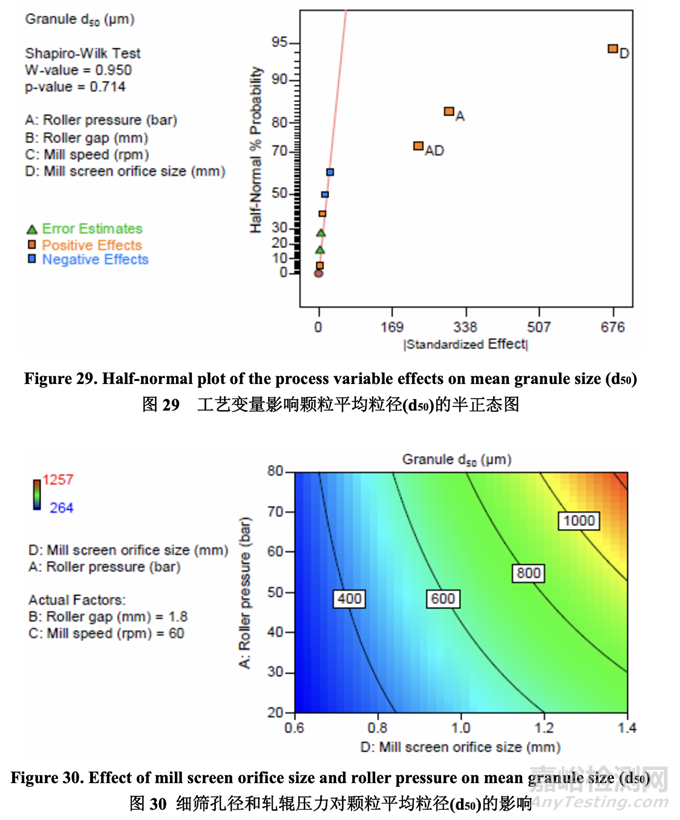
The half-normal plot (Figure 29) shows that the significant factors affecting mean granule size (d50) were D (mill screen orifice size), A (roller pressure) and AD (their interaction). 半正态图(图29)表明,影响颗粒平均粒径(d50)的显著因素为D (细筛孔径), A (轧辊压力)和AD (它们的交互作用)。
The contour plot presented in Figure 30 shows the effect of mill screen orifice size and roller pressure on granule d50. It is evident that d50 increased with increasing mill screen orifice size and roller pressure (positive effect). These two parameters also exhibited a strong interaction (i.e., roller pressure showed a larger impact on mean granule size when using a larger mill screen orifice size).
图 30 呈现的等高线图显示了细筛孔径和轧辊压力对颗粒 d50 的影响。很明显,d50 随细筛 孔径和轧辊压力(正作用)的增加而增加。这两个参数也显示了强烈的交互作用(即轧辊压力显示出对颗粒平均粒径具有较大影响当使用较大孔径的细筛时)。
Significant factors for granule flowability 颗粒流动性的显著因素
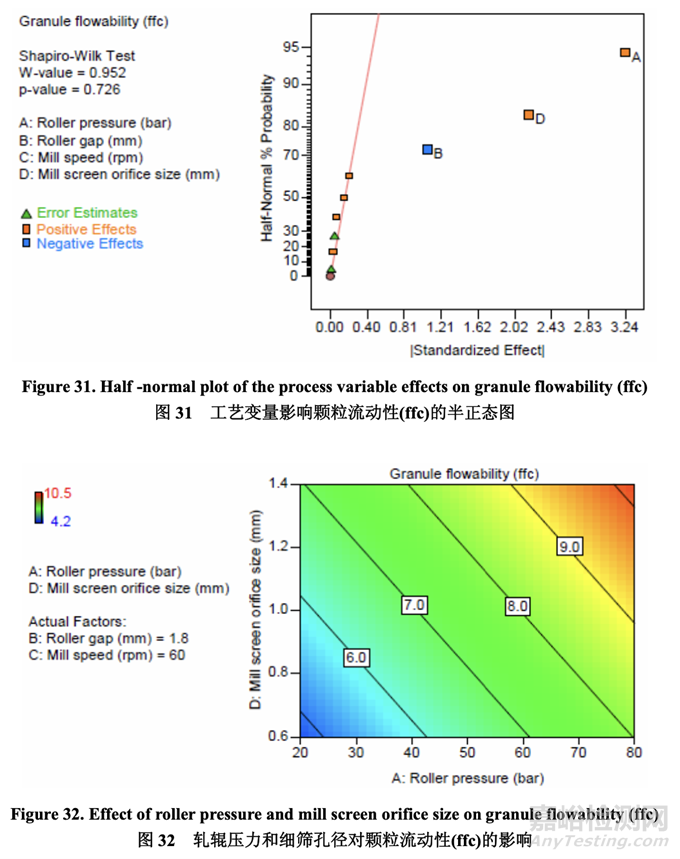
The flowability (represented by ffc value) of the granules after milling was determined using a ring shear tester. As shown in the half-normal plot (Figure 31), the significant factors affecting granule flowability were A (roller pressure), D (mill screen orifice size) and B (roller gap). The effect of roller pressure and mill screen orifice size on granule flowability is shown in Figure 32. Granule flowability improved with increasing roller pressure and mill screen orifice size. Roller gap also had an impact on granule flowability but to a lesser extent. 使用环剪仪测量粉碎后的颗粒流动性(以 ffc 值表示)。如半正态图(图 31)所示,影响颗粒流 动性的显著因素为 A (轧辊压力), D (细筛孔径)和 B (轧辊间隙)。轧辊压力和细筛孔径对颗粒 流动性的影响见图 32。颗粒流动性随轧辊压力和细筛孔径增加而提高。轧辊间隙对颗粒流 动性也有影响但程度较轻。
Significant factors for granule uniformity (% RSD) 颗粒均匀度(% RSD)的显著因素
All batches demonstrated acceptable granule uniformity (ranging from 2.0-2.9% RSD) and none of the process variables showed a significant impact on this response.
所有批显示出可接受的颗粒均匀度(RSD范围为2.0~2.9%),无工艺变量显示出对该响应具有 显著影响。
Significant factors for assay of granule sieve cuts 筛分颗粒含量的显著因素
Approximately 10 g of granules were sampled from each batch and transferred to the top of a set of seven sieves stacked by decreasing size: 840 μm, 420 μm, 250 μm, 180 μm, 149 μm, 75 μm and pan (no opening for fine collection). The sieves were shaken for five minutes on a laboratory particle size analyzer. The assay of sieve cuts collected from each batch was analyzed. All batches demonstrated acceptable assay for each granule sieve cut (ranging from 98.2-102.0%). This data confirmed that segregation of the pre-roller compacted blend did not occur. None of the factors were shown to have a significant impact on the assay of granule sieve cuts.
每批取样约10 g颗粒,转移至一套按孔径降序:840 μm, 420 μm, 250 μm, 180 μm, 149 μm, 75 μm和平地器皿(没有用于细粉收集的孔)堆积的7个筛的顶部。在实验室粒度分析仪上振摇筛5 分钟。分析每批采集的筛分含量。所有批显示每批筛分颗粒的含量是合格的(范围为98.2~ 102.0%)。该数据确认预碾压混合不发生分离。无因素显示对筛分颗粒的含量有显著影响。 Significant factors for tablet hardness 片剂硬度的显著因素
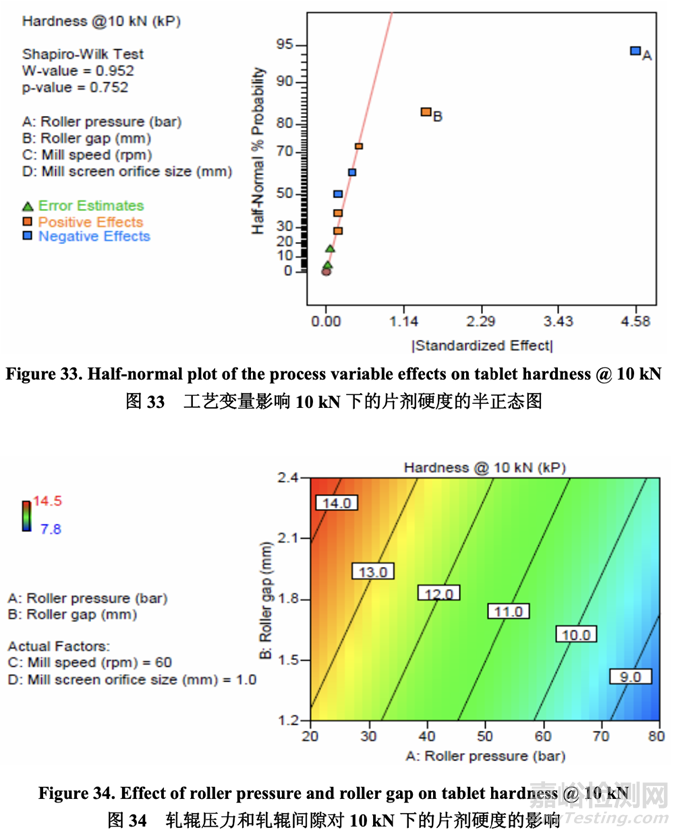
As shown in the half-normal plot (Figure 33), the significant factors affecting tablet hardness when compressed using 10 kN of force were A (roller pressure) and B (roller gap). The effect of roller pressure and roller gap on tablet hardness is presented in Figure 34. Tablet hardness decreased with increasing roller pressure and decreasing roller gap.
如半正态图(图 33)所示,当使用 10 kN 力压缩时,影响片剂硬度的显著因素为 A (轧辊压力) 和 B (轧辊间隙)。轧辊压力和轧辊间隙对片剂硬度的影响见图 34。片剂硬度随随轧辊压力 增加而减少,随轧辊间隙减少而减少。
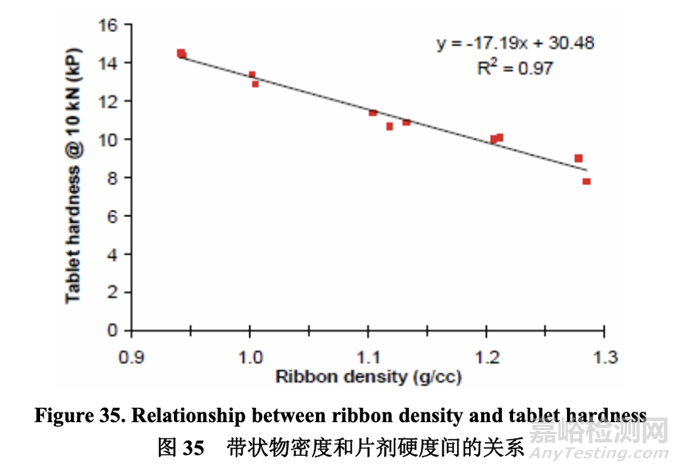
Since both ribbon density and tablet hardness were impacted by roller pressure and roller gap, it was logical to evaluate if any correlation existed between these two quality attributes. As shown in Figure 35, an inverse relationship was observed between ribbon density and tablet hardness. The establishment of this relationship was significant as it enables an intermediate material attribute (ribbon density) to be used as an in-process control during roller compaction to facilitate successful downstream operation (tablet compression) and ensure the target for a final product quality attribute (dissolution) is met.
因为带状物密度和片剂硬度都受轧辊压力和轧辊间隙影响,所以评估这两个质量属性间是否 存在任何相关性是合理的。如图 35 所示,观察到带状物密度和片剂硬度间有逆相关性。建 立该相关性是重要的因为它能使中间体物料属性(带状物密度)在碾压中作为在线控制使用 以方便下游运行(压片)成功并保证符合最终产品质量属性(溶出)的目标。
Significant factors for tablet friability 片剂脆碎度的显著因素
All tablets manufactured in Batch Nos. 37-47 exhibited acceptable friability (< 0.2% weight loss) when compressed using 10 kN and 15 kN of force. When 5 kN of compression force was used, Batch Nos. 41 and 44 exhibited low tablet hardness (< 5.0 kP) and failed the friability test. These two batches had high ribbon density (~ 1.28 g/cc). The remainder of the batches compressed using 5 kN of force showed acceptable friability (< 0.2% weight loss) and hardness was higher than 5.0 kP.
当用10 kN和15 kN力压缩时,生产的所有片剂,批号37~47,显示出脆碎度合格(重量损失< 0.2%)。当使用5 kN压缩力时,批号41和44显示出片剂硬度低(< 5.0 kP),脆碎度实验不合格。 这两批的带状物密度高(~ 1.28 g/cc)。用5 kN力压缩的其余批次显示出脆碎度合格(重量损失< 0.2%),硬度高于5.0 kP。
Significant factors for tablet assay 片剂含量的显著因素
All batches demonstrated acceptable assay (ranging from 98.4-100.6%) which is well within the specification limits (95.0-105.0% w/w) and none of the factors showed a significant impact on tablet assay. 所有批都显示出含量合格(范围为98.4~100.6%),处于质量标准限度(95.0~105.0% w/w)内, 无因素显示出对片剂含量有显著影响。
Significant factors for tablet content uniformity (% RSD)
片剂含量均匀度(% RSD)的显著因素
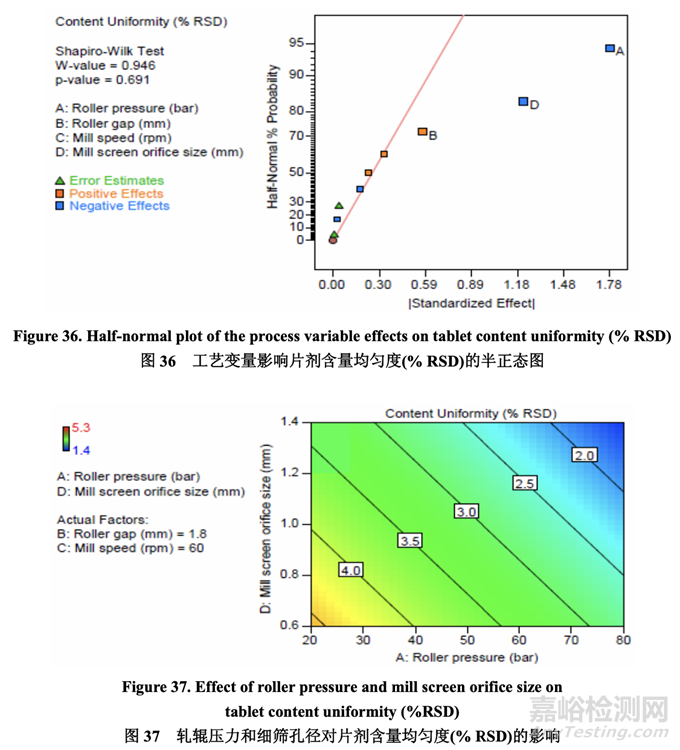
Data analysis indicated that the curvature effect was not significant for tablet content uniformity. As shown in the half-normal plot (Figure 36), the significant factors affecting tablet content uniformity were A (roller pressure), D (mill screen orifice size) and B (roller gap).
数据分析表明曲率效应对片剂含量均匀度无意义。如半正态图(图36)所示,影响片剂含量均 匀度的显著因素为A (轧辊压力), D (细筛孔径)和B (轧辊间隙)。
Figure 37 shows the effect of roller pressure and mill screen orifice size on tablet content uniformity. Tablet content uniformity improved as evidenced by a decreased % RSD with increasing roller pressure and mill screen orifice size. Roller gap had some impact on tablet content uniformity but to a lesser extent.
图 37 显示了轧辊压力和细筛孔径对片剂含量均匀度的影响。片剂含量均匀度随轧辊压力和 细筛孔径的增加而提高,通过% RSD减少所证明。轧辊间隙对片剂含量均匀度有影响但程 度较轻。
Significant factors for tablet disintegration 片剂崩解的显著因素
All batches demonstrated rapid disintegration (< 4 min). None of the process variables studied had a significant impact on the disintegration time.
所有批显示出快速崩解(< 4 min)。无研究的工艺变量对崩解时间有显著影响。
Significant factors for tablet dissolution 片剂溶出的显著因素
Tablet hardness had a significant impact on dissolution (see Section 2.3.5 Tablet Compression Process Development). Based on the inverse linear relationship between ribbon density and tablet hardness, it can be concluded that roller compaction will have an indirect impact on dissolution. For a ribbon with a reasonable density, target hardness can be achieved by adjusting the main compression force. However, it is well known that powder material loses a certain extent of its compressibility and compactability when roller compacted. Consequently, higher compression force is required to achieve the same tablet hardness for a higher ribbon density than for a lower ribbon density. On the other hand, when the ribbon density was low (≤ 1.0 g/cc), the flowability of the granules (Batches 2 and 3) was low (ffc < 6). Therefore, a range for ribbon density needs to be established such that the desired granule flowability is achieved and the required compression force will not exceed the maximum allowable tool tip pressure recommended by the tooling manufacturer. Based on the DOE results for tablet friability and granule flowability, the ribbon density will be controlled between 1.0-1.2 g/cc (i.e., ribbon relative density between 0.68-0.81; ribbon true density is 1.4803 g/cc in this study).
片剂硬度对溶出有显著影响(见2.3.5节压片工艺开发)。基于带状物密度和片剂硬度间对逆线 性关系,可得出结论,碾压将间接影响溶出。对于密度合理的带状物,通过调整主压缩力来 达到目标硬度。但是,众所周知,粉末物料在碾压时,会失去一定程度的压缩性和压实性。 因此,较高带状物密度比较低带状物密度,为达到相同的片剂硬度需较高的压缩力。另一方 面,但带状物密度低(≤ 1.0 g/cc)时,颗粒(批2和3)的流动性低(ffc < 6)。因此,需确定带状物 密度范围以便达到预期的颗粒流动性并且所需的压缩力将不超过模具生产商建议允许的最 大工具提示压力。基于片剂脆碎度和颗粒流动性的DOE结果,带状物密度应控制在1.0-1.2 g/cc(即带状物相对密度为0.68~0.81;该研究中的带状物真密度为1.4803 g/cc)。
Summary of roller compaction and integrated milling process development
碾压和集成粉碎工艺开发的总结
Roller pressure had a significant impact on ribbon density, mean granule size (d50), granule flowability, tablet hardness and tablet content uniformity. Increasing roller pressure increased ribbon density, granule mean particle size (d50), granule flowability and tablet content uniformity (lower % RSD). However, it had a negative impact on the compressibility and compactability of the granules as indicated by decreasing tablet hardness for any given compression force.
轧辊压力对带状物密度、颗粒平均粒径(d50)、颗粒流动性、片剂硬度和片剂含量均匀度有 显著影响。轧辊压力增加,带状物密度、颗粒平均粒径(d50)、颗粒流动性和片剂含量均匀 度(% RSD较低)增加。但是,对任何给定的压缩力,它对颗粒的压缩性和压实性有负影响, 如减少片剂硬度所示。
Roller gap exhibited a significant impact on ribbon density, granule flowability, tablet hardness and tablet content uniformity. Increasing the roller gap decreased ribbon density, granule flowability and tablet content uniformity (higher % RSD). However, tablet hardness at a given compression force increased with increasing roller gap. 轧辊间隙对带状物密度、颗粒流动性、片剂硬度和片剂含量均匀度有显著影响。轧辊间隙增 加,带状物密度、颗粒流动性和片剂含量均匀度(% RSD较高)减少。但是,在给定压缩力下, 片剂硬度随轧辊间隙增加而增加。
Mill screen orifice size had a significant impact on mean granule size (d50), granule flowability and tablet content uniformity. Increasing mill screen orifice size increased granule mean particle size (d50), granule flowability and tablet content uniformity (lower % RSD). 细筛孔径对颗粒平均粒径(d50)、颗粒流动性和片剂含量均匀度有显著影响。细筛孔径增加, 颗粒平均粒径(d50)、颗粒流动性和片剂含量均匀度(% RSD较低)增加。
Mill speed did not show a significant impact on any of the responses studied. In addition, no curvature effects were observed for any of the responses. Based on the results of the DOE study, roller pressure, roller gap and mill screen orifice size were identified as the CPPs while mill speed was determined to be not critical.
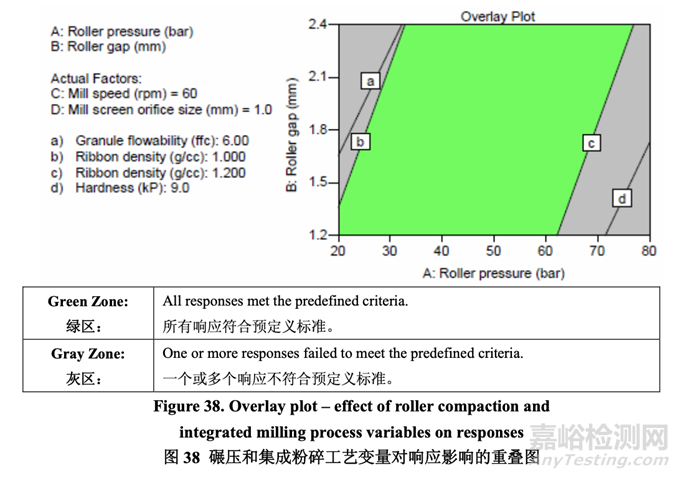
粉碎机速度对任何研究的响应未显示出有显著影响。此外,任何响应未观察到曲率效应。基 于DOE研究的结果,当确定粉碎机速度为非关键时,确定轧辊间隙和细筛孔径为CPPs。 The overlay plot shown in Figure 38 was used to identify an appropriate range for each CPP that would ensure that the targets for all quality attributes are met concurrently. A mill screen orifice size of 1.0 mm was selected because it allows a wider acceptable operating range for both roller pressure and roller gap compared to the other studied sizes (0.6 mm and 1.4 mm). Based on the results, the acceptable ranges for roller pressure and roller gap were identified as 20-77 bar and 1.2-2.4 mm, respectively, for the roller compaction and integrated milling process step using an Alexanderwerk WP120 equipped with a knurled roller that is 120 mm in diameter and 25 mm in width.
图 38 所示的重叠图用于确定每个 CPP 的合适范围,可保证所有质量属性都同时符合其目标。 选择细筛孔径为 1.0 mm,因为相比于其他研究的孔径(0.6 mm 和 1.4 mm),它提供了轧辊压 力和轧辊间隙一个较宽的可接受操作范围。基于结果,对于使用装备滚花辊(直径为 120 mm 和宽为25 mm)的Alexanderwerk WP120的碾压和集成粉碎工艺步骤,确定了轧辊压力和轧 辊间隙可接受范围分别为 20~77 bar 和 1.2~2.4 mm。
Updated Risk Assessment of the Roller Compaction and Integrated Milling Process Variables
更新的碾压和集成粉碎工艺变量的风险评估
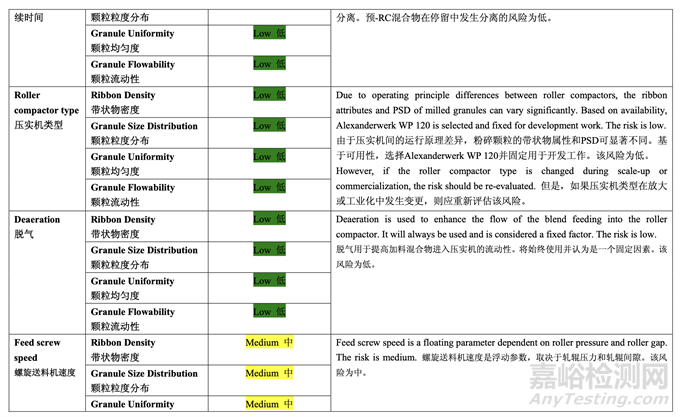
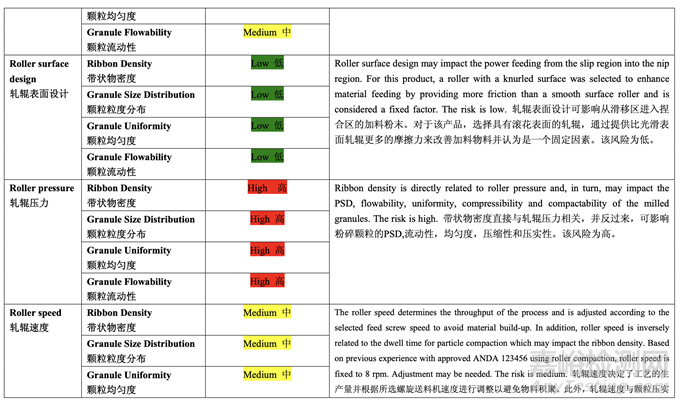
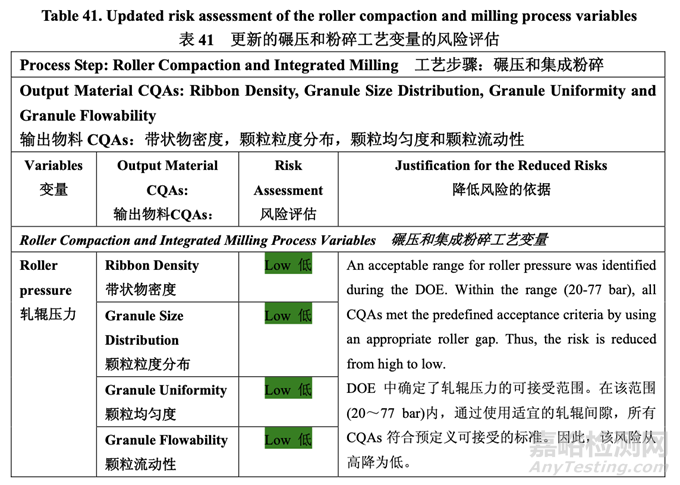
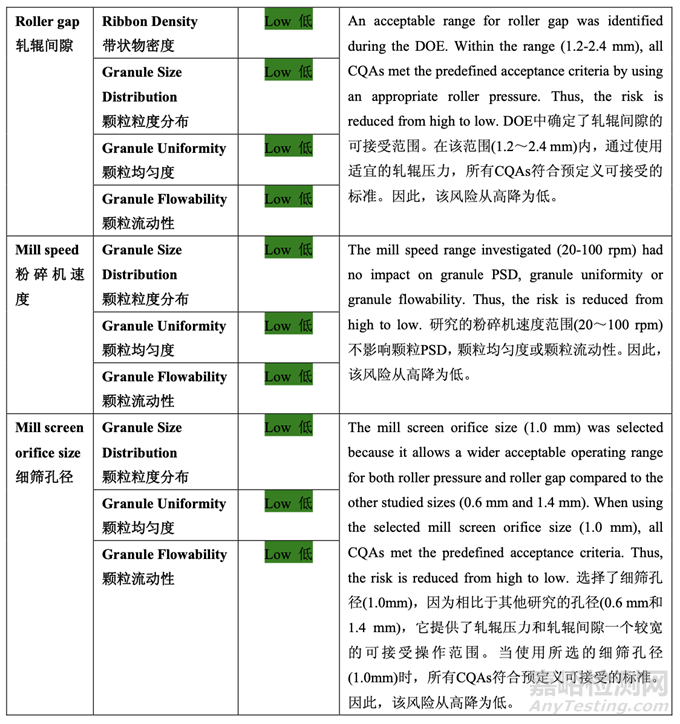
Table 41 presents the risk reduction for the roller compaction and integrated milling process variables as a result of the development studies. Justification of the reduced risks is also provided. 表 41 呈现了由于开发研究,降低了碾压和集成粉碎工艺变量的风险。也提供了风险降低的 依据。
参考文献:
Example QbD IR Tablet Module 3 Quality 3.2.P.2 Pharmaceutical Development,FDA,2012.
